Modeling of High COVID-19 Disease Burden Areas in New York City Using Location Data
By Chengda Zhang, MD
5/14/2020
Abstract
Rationale: The New York City (NYC) has experienced an outbreak of COVID-19 in the past 3 months. According to the data presented by NYC Health Department, different neighborhoods or modified zip code areas (MODZCTA) are affected differently by COVID-19. Distribution of stores/facilities/restaurants/clubs in neighborhood may directly affect the outbreak or be indirectly associated with COVID-19 through close connection with local social economic status. In this study, we aim to use location data from Foursquare.com to model the disease burden of COVID-19 in different MODZCTAs of NYC.
Methods: COVID-19 case burden by MODZCTA and geographic boundary of each MODZCTA are obtained from NYC Health Department on 5/13/2020. NYC venues and category information is queried from Foursquare. All venues are categorized into 10 groups, as well as 412 more detailed “venue categories” assigned by Foursquare. The modeling was attempted with linear, polynomial regression, and multi-layer perceptron, random forest, gradient boosting classifiers. Regression models target to predict case numbers of an MODZCTA, classifiers target to identify MODZCTA with high disease burden (case number>1,500). All analysis was done with Python 3, and source code could be found at Github[1].
Results: The linear and polynomial regression models were evaluated with 10-fold cross validation, and average of R2 were -1.34 and -34.88 respectively, indicating poor correlation. The three classifiers were compared with dummy selector. Gradient boosting classifier had the best performance as evaluated by 5-fold cross validation, with mean accuracy of 83%, recall (or sensitivity) of 61%, precision of 91%, and F1 score of 0.63, while the dummy selector had mean accuracy of 78%, recall of 50%, precision of 39% and F1 score of 0.44.
Conclusions: We have identified a classifier with relatively robust precision in identifying high disease burden neighborhood. However, it has low sensitivity, and should not be used as the only decision support method.
-
Introduction
-
Background
The New York City (NYC) has experienced an outbreak of COVID-19 in the past 3 months. According to the data presented by NYC Health Department, different neighborhoods or modified zip code areas (MODZCTA) are affected differently by COVID-19. Distribution of stores/facilities/restaurants/clubs in NYC may directly affect the outbreak or be indirectly associated with COVID-19 through close connection with local social economic situation. Therefore the location data may be helpful in predicting disease burden of a certain neighborhood.
-
Problem
As more US cities are facing outbreaks of COVID-19, modeling case burden of COVID-19 in NYC will help us allocate proper resources and polices to other urban areas.
-
Goal
I aim to use location data from Foursquare to model the disease burden of COVID-19 in different MODZCTAs of NYC.
-
-
Data acquisition and cleaning
-
Data source
COVID-19 case burden by MODZCTA and geographic boundary of each MODZCTA are obtained from NYC Health Department on 5/13/2020. The distribution of cases by neighborhoods can be viewed on a map. NYC venues and category information is queried from Foursquare. First, the coordinates of all NYC neighborhoods (geographic center) were obtained from NYU. Then the coordinates were used to query Foursquare, pulling up to 277 venues information within 500 meters radius on map.
-
Data cleaning
After obtaining data, we use geographic boundary to determine which MODZCTA a venue belongs to. We have discarded all venues that are not physically located in any MODZCTAs.
-
Feature selection
All venues are categorized into 10 groups: Food, College or University, Event, Arts and Entertainment, Nightlife Spot, Outdoors or Recreation, Professional or Other Places, Shop or Services, Travel or Transport, and Residence. The number of venues of each group in a certain neighborhood will be used as features for linear regression as well as polynomial regression.
Foursquare also asigns a "Venue Category" parameter to each venue, which is more detailed than the above 10 groups. For example, a restaurant could be categorized as a "American restaurant" rather than the general term "food". All venues belongs to 412 venue categories. The number of venues of each venue category in a certain neighborhood will be used as features for Multi-layer Perceptron Classifier, Random Forest Classifier and Gradient Boosting Classifier, after transformed with Sklearn Standard Scaler.
-
-
Exploratory analysis
-
Multivariate linear regression
Multivariate linear regression was performed to explore model that could predict the number of cases in each MODZCTA. The dataset were randomly split into training sample (90% of data) and testing sample (10% of data) using train-test split function of Sklearn. After a linear regression model was trained using training sample, a distribution plot of predicted value using testing sample vs actual value was made.
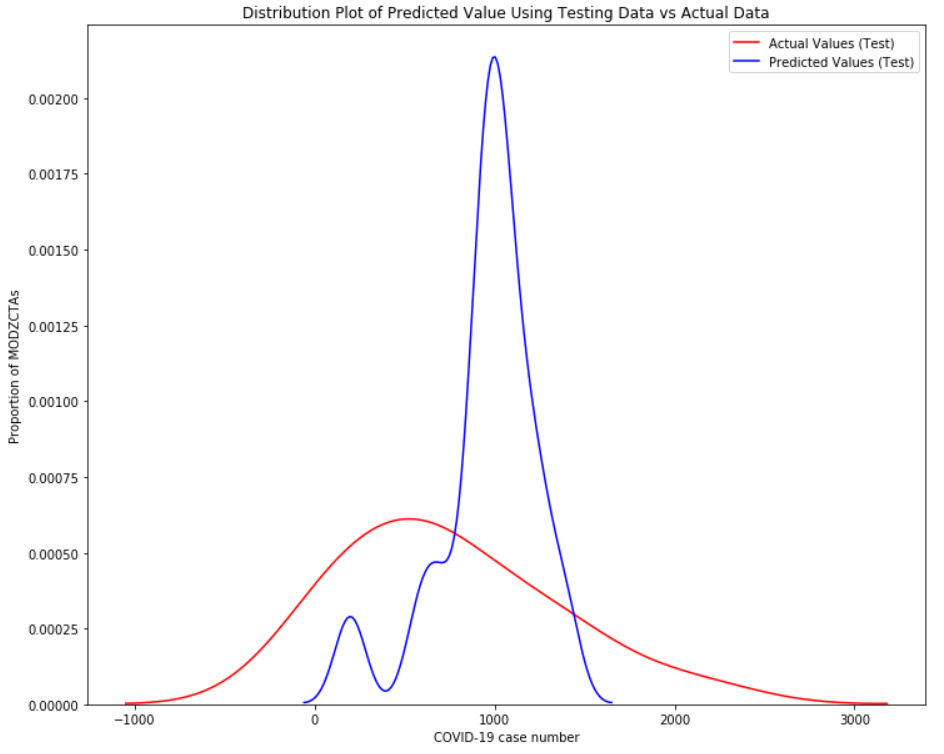
Figure 1 Distribution plot of predicted value using testing data vs actual data by multivariate linear regression
The model was evaluated using R2 score by 10-fold crossvalidation. The mean value for R2 was -1.34, indicating poor performance of the model.
Polynomial regression
Then Polynomial regression was performed to explore model that could predict the number of cases in each MODZCTA. The 10 features were transformed using Sklearn Polynomial Features function into 55 variables. The dataset were then randomly split into training sample (90% of data) and testing sample (10% of data) using train-test split function of Sklearn. After a linear regression model was trained using training sample, a distribution plot of predicted value using testing sample vs actual value was made.
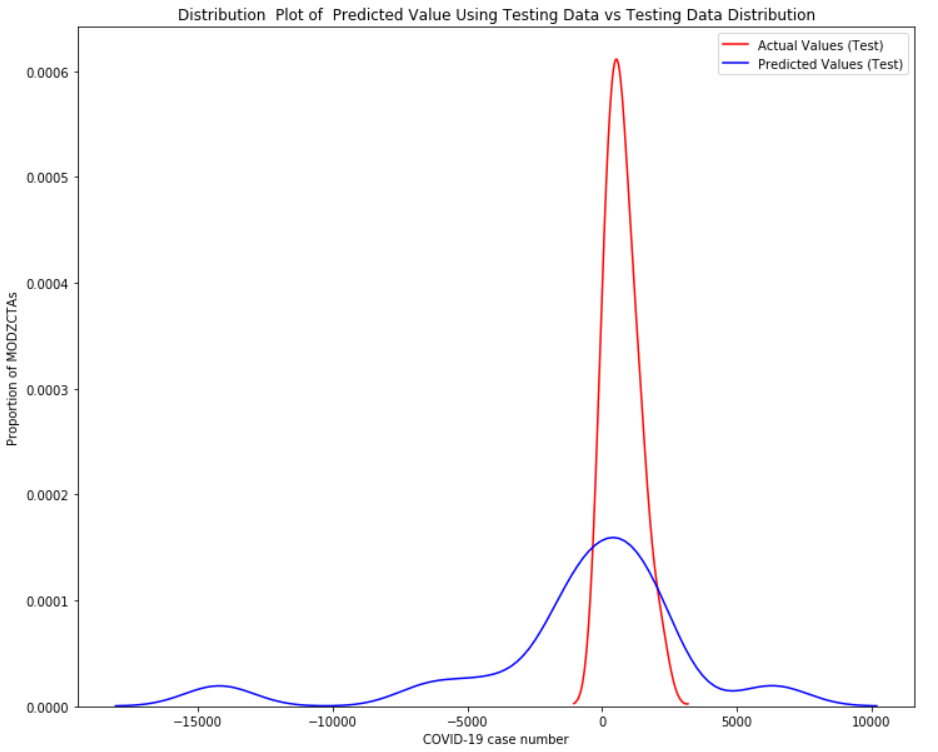
Figure 2 Distribution plot of predicted value using testing data vs actual data by polynomial regression
The model was evaluated using R2 score by 10-fold crossvalidation. The mean value for R2 was -34.88, indicating poor performance of the model.Due to the poor performance of regression models, it is believed that although venue categories may be partially associated with COVID-19 case number, it could not explain the full variation between neighborhoods. A regression model using geographic data to accurately predict COVID-19 case number may not exist. Therefore, the case number is converted into a categorical target called "high disease burden" defined as more than 1,500 cases in the MODZCTA. Fourty-one out of 177 MODZCTAs are identified as high disease burden areas. We will attempt to make classifiers that could recognize high disease burden MODZCTAs.
-
-
Results
-
Multi-layer Perceptron Classifier
As above, the classifier was built using vanue category, and the target was to identify high disease burden MODZCTA. We first set alpha=1e-5. The classifier was then evaluated using accuracy, recall, precision and F1 score, by 5-fold crossvalidation.
Table 1 Crossvalidation result of multi-layer perceptron classifier, alpha=1e-5 Parameters Round 1 Round 2 Round 3 Round 4 Round 5 Mean Accuracy 0.88 0.81 0.74 0.68 0.64 0.75 Recall 0.71 0.72 0.58 0.59 0.57 0.64 Precision 0.93 0.72 0.60 0.58 0.55 0.68 F1 0.76 0.72 0.59 0.58 0.55 0.64 Alpha was then set to 0.01. Another 5-fold crossvalidation was performed.
Table 2 Crossvalidation result of multi-layer perceptron classifier, alpha=0.01 Parameters Round 1 Round 2 Round 3 Round 4 Round 5 Mean Accuracy 0.84 0.77 0.74 0.68 0.68 0.74 Recall 0.69 0.60 0.63 0.59 0.59 0.62 Precision 0.80 0.66 0.63 0.58 0.58 0.65 F1 0.72 0.61 0.63 0.58 0.58 0.62 -
Random Forest Classifier
The random forest classifier was made and evaluated by 5-fold crossvalidation. Result is shown below.
Table 3 Crossvalidation result of random forest classifier Parameters Round 1 Round 2 Round 3 Round 4 Round 5 Mean Accuracy 0.81 0.84 0.84 0.81 0.77 0.81 Recall 0.57 0.69 0.64 0.57 0.55 0.60 Precision 0.90 0.80 0.91 0.90 0.65 0.83 F1 0.57 0.72 0.68 0.57 0.54 0.62 -
Gradient Boosting Classifier
The gradient boosting classifier was made and evaluated by 5-fold crossvalidation. Result is shown below.
Table 4 Crossvalidation result of gradient boosting classifier Parameters Round 1 Round 2 Round 3 Round 4 Round 5 Mean Accuracy 0.81 0.84 0.84 0.81 0.84 0.83 Recall 0.57 0.64 0.64 0.57 0.64 0.61 Precision 0.90 0.91 0.91 0.90 0.91 0.91 F1 0.57 0.68 0.68 0.57 0.68 0.63 -
Dummy Selector
The performance of dummy selector using the same dataset is listed here for comparison with the above classifiers.
Table 5 Crossvalidation result of dummy selector Parameters Round 1 Round 2 Round 3 Round 4 Round 5 Mean Accuracy 0.78 0.77 0.77 0.77 0.77 0.78 Recall 0.50 0.50 0.50 0.50 0.50 0.50 Precision 0.39 0.39 0.39 0.39 0.39 0.39 F1 0.44 0.44 0.44 0.44 0.44 0.44
-
-
Discussion
In this study, we used location data to predict disease burden of COVID-19 in NYC's MODZCTAs. We identified two classifier models, namingly gradient boosting and random forest classifiers, that showed relatively higher accuracy and precision.
When looking for a model to identify high disease burden areas, we really wants the sensitivity (or recall score, the equivalent term in machine learning) to be as high as possible, because missing an area with high disease burden may cause more harm than allocating too much resource to an area that does not need it. The recall score of all 3 classifiers were only slightly higher than dummy selector, indicating poor performance. Therefore, the use of the above classifiers, especially when applying to other US cities should be done with extreme caution.
With a high precision in the gradient boosting and random forest classifiers, a neighborhood classified as high disease burden area is of high likelyhood of becoming one.
The limitation of this study is that NYC is a unique city of US. Data from NYC may not be applicable to the rest of US cities. Our model does not consider racial distribution, healthcare resources, and other known confounding factors for COVID-19 disease burden, therefore the results of this study is weakened, and there should not be any causal relationship made from our data. (ie, one should never conclude that a certain type of venue is associated with COVID-19 from this study.) -
Conclusion
We have identified two classifiers with relatively robust precision in identifying high disease burden neighborhood. However, those models have low sensitivity, and should not be used as the only decision support method.
This work is solely done by Chengda Zhang, MD. The source code of this work is available through Github.